Business Performance
Consolidated Financial Highlights | Charts
* Please see by swiping to the following table.
| Period | 68th | 69th | 70th | 71st | 72nd |
|---|---|---|---|---|---|
| Fiscal Ending | Mar 2022 | Mar 2023 | Mar 2024 | Mar 2025 | Mar 2026 |
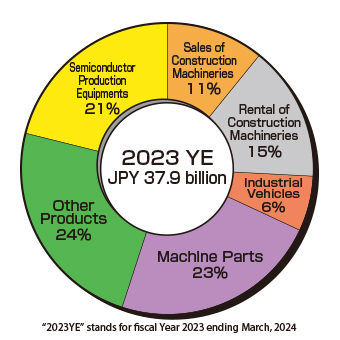
| Sales (mil, JPY) | 34,818 | 39,339 | 37,991 | 36,535 | 36,815 |
| Ordinary Profit (mil, JPY) | 2,659 | 3,225 | 3,036 | 3,114 | 3,050 |
| Net Income (mil, JPY) | 1,739 | 2,146 | 1,991 | 2,038 | 2,356 |
| Comprehensive Income (mil, JPY) | 1,689 | 2,354 | 2,941 | 1,620 | 2,911 |
| Net Assets (mil, JPY) | 20,880 | 22,723 | 24,692 | 25,663 | 27,492 |
| Total Assets (mil, JPY) | 37,310 | 41,064 | 42,886 | 41,201 | 42,137 |
| BPS (JPY) | 1,638.34 | 1,781.20 | 1,977.17 | 2,053.04 | 2,244.98 |
| EPS (JPY) | 136.52 | 168.31 | 156.60 | 163.09 | 190.00 |
| Capital Adequecy Ratio (%) | 56.0 | 55.3 | 57.6 | 62.3 | 65.2 |
| ROE (%) | 8.6 | 9.8 | 8.4 | 8.1 | 8.9 |
| PER (times) | 6.9 | 6.7 | 8.2 | 7.1 | 7.6 |
| Cash Flow from Operations (mil, JPY) |
2,726 | 1,688 | 5,247 | 4,936 | 4,106 |
| Cash Flow from Investments (mil, JPY) |
-2,332 | -2,846 | -2,452 | -2,182 | -1,283 |
| Cash Flow from Financing Activities (mil, JPY) |
-619 | -637 | -1,884 | -951 | -1,340 |
| Cash and Cash Equivalents at End of Year (mil, JPY) |
7,971 | 6,192 | 7,123 | 8,972 | 10,465 |
| Employees | 450 | 475 | 508 | 504 | 521 |
Non-consolidated Financial Highlights of NANYO CORPORATION | Charts
* Please see by swiping to the following table.
| Period | 68th | 69th | 70th | 71st | 72nd |
|---|---|---|---|---|---|
| Fiscal Ending | Mar 2022 | Mar 2023 | Mar 2024 | Mar 2025 | Mar 2026 |
| Sales (mil, JPY) | 25,904 | 29,579 | 27,131 | 25,834 | 23,620 |
| Ordinary Profit (mil, JPY) | 1,265 | 1,825 | 1,545 | 1,480 | 1,215 |
| Net Income (mil, JPY) | 855 | 1,287 | 1,060 | 1,052 | 1,145 |
| Capital (mil, JPY) | 1,181 | 1,181 | 1,181 | 1,181 | 1,181 |
| Stocks Issued (shares) | 6,615,070 | 6,615,070 | 6,615,070 | 13,230,140 | 13,230,140 |
| Net Assets (mil, JPY) | 13,750 | 14,651 | 15,594 | 15,444 | 15,988 |
| Total Assets (mil, JPY) | 26,748 | 29,200 | 30,470 | 28,048 | 25,894 |
| BPS (JPY) | 1,078.91 | 1,148.45 | 1,248.68 | 1,235.57 | 1,305.54 |
| Dividend per share (JPY) | 82.00 | 101.00 | 101.00 | 58.00 | 68.00 |
| (Midterm dividend per share) | 15.00 | 15.00 | 15.00 | 10.00 | 10.00 |
| EPS (JPY) | 67.10 | 100.93 | 83.39 | 84.25 | 92.35 |
| Capital Adequecy Ratio (%) | 51.4 | 50.2 | 51.2 | 55.1 | 61.7 |
| ROE (%) | 6.3 | 9.1 | 7.0 | 6.8 | 7.3 |
| PER (times) | 14.0 | 11.2 | 15.4 | 13.7 | 15.6 |
| Payout Ratio (%) | 61.1 | 50.0 | 60.6 | 68.8 | 73.6 |
| Employees | 161 | 155 | 153 | 158 | 158 |
Sales Composition by Lines of Business